Examples
See 168 in action.
Every building in America has a different population every hour of the week. These are short demos showing what that actually looks like — built from real data, rendered honestly.
01 · Featured
A city wakes up.
474,000 worker movements across Massachusetts, modeled hour by hour. Pre-dawn, the inbound corridor fills. By 5pm it reverses. Same workers, same roads — built from federal employment data. We see workers, not devices.
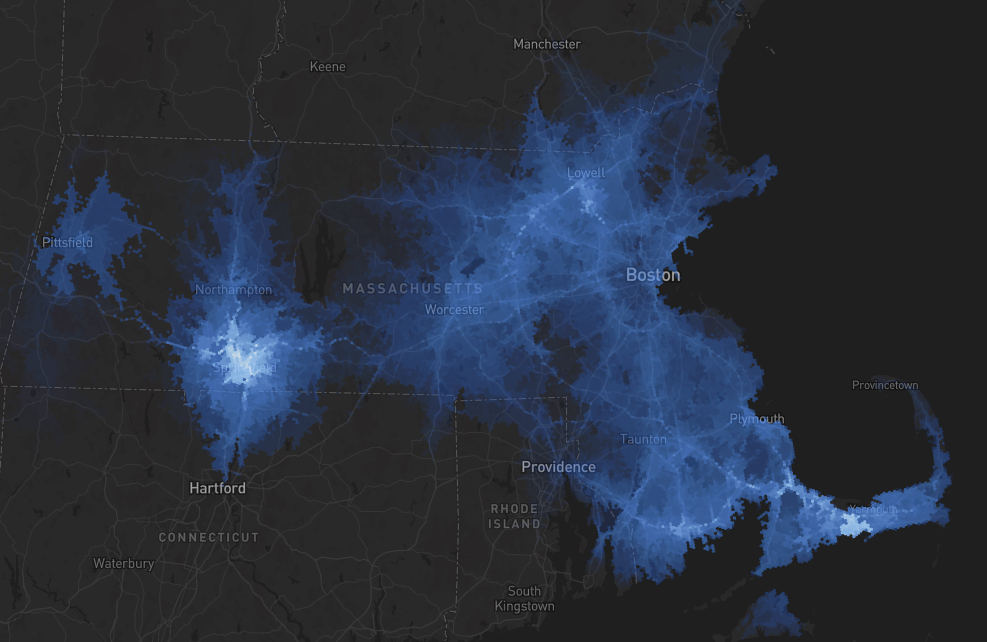
▶Springfield · commute flowSee on etherdata.ai →
Massachusetts · 474K worker movements · hour by hourBuilt with Mapbox by Ivan
02
LaGuardia, hour by hour.
2,800 workers cycling through one airport. The city's clock, on a single block. Watch the workforce arrive, peak, and leave — building by building, hour by hour. Same building, same hour, different week — the structural pattern holds.
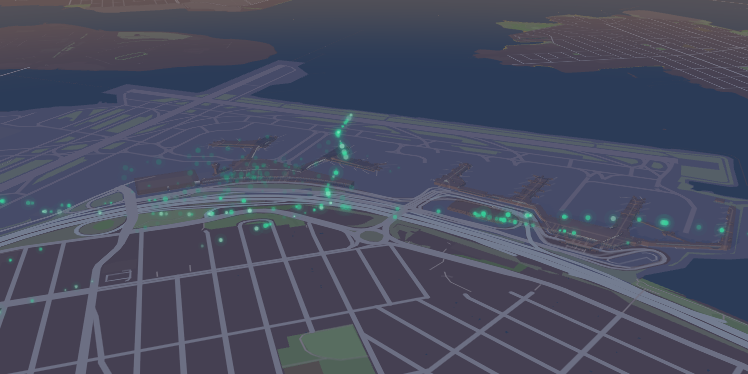
▶LaGuardia · live modelSee on etherdata.ai →
1 airport · 2,800 workers · 168 hoursBuilt with Mapbox by Ivan
Bring your model.
We bring the where and the when.